Friday, August 29, 2014

Rail Deliveries of U.S. Oil Continue to Increase in 2014


Graph of average weekly U.S. rail carloads of crude oil and petroleum products, as explained in the article text
Source: U.S. Energy Information Administration, based on Association of American Railroads
Note: Values in graph represent monthly averages of weekly rail carloadings.


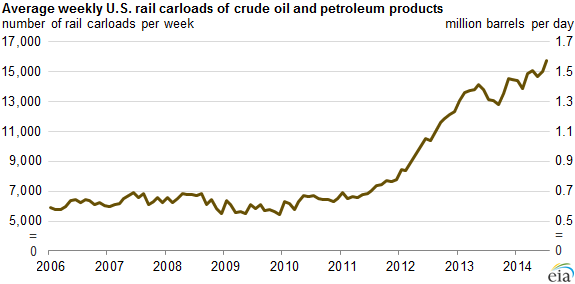
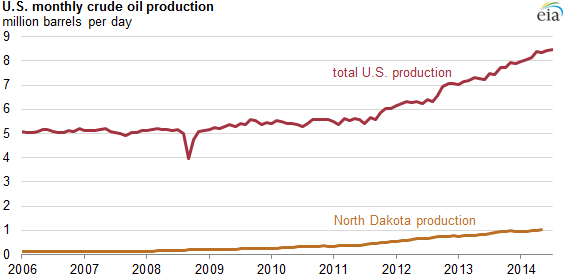
The amount of crude oil and refined petroleum products moved by U.S. railroads increased 9% during the first seven months of this year compared with the same period in 2013. In July, monthly average carloadings of oil and petroleum products were near 16,000 carloads per week, according to the Association of American Railroads (AAR). The increase in oil volumes transported by rail reflects rising U.S. crude oil production, which reached an estimated 8.5 million barrels per day in June for the first time since July 1986.

AAR estimates that more than half of the nearly 460,000 carloads tracked in its petroleum and petroleum products category from January through July consisted of crude oil, up from around 3% in 2009. With the average rail tank car holding around 700 barrels of crude oil, about 759,000 barrels of crude oil per day were moved by rail during the first seven months of 2014, equal to 8% of U.S. oil production.
Graph of U.S. monthly crude production, as explained in the article text
Source: U.S. Energy Information Administration, Short-Term Energy Outlook and Petroleum Supply Monthly
Note: June and July oil production estimated from EIA's Short-Term Energy Outlook.


The Bakken Shale, primarily in North Dakota, has provided a significant share of the total increase in U.S. oil production over the past three years. North Dakota, now the second-largest oil producing state, provides nearly one out of every eight barrels of oil produced in the United States. Between 60% and 70% of the more than 1 million barrels per day of oil produced in the state has been transported to refineries by rail each month in the first half of 2014, according to the North Dakota Pipeline Authority.

In the future, proposed rules published in August by the U.S. Department of Transportation to improve the safety of tank cars will affect how crude oil is moved by rail, particularly trains that carry 20 or more carloads of oil. The proposed rules would require new oil tank cars constructed after October 2015 to have thicker steel and require retrofitting of existing tank cars. Voluntary actions by railroads in anticipation of the new rules have resulted in reduced speeds and increased inspections. (DOE-EIA)

Obama Administration Appliance Efficiency Standards

The Obama administration is working on new efficiency standards for seemingly every appliance but the kitchen sink.  The Department of Energy (DOE) is drafting new standards for refrigerators, dishwashers, air conditioners, ceiling fans, furnaces, boilers, water heaters, lamps and many more appliances.  The administration says the standards will not only help the planet but also stimulate the economy by saving consumers money on their energy bills that they can spend elsewhere.

The Energy Department has already finalized new efficiency standards for seven appliances in 2014, with another three rules expected by the end of the year. That compares to two rules in 2013 and three in 2012.  DOE believes the rules will save consumers $49 billion by 2030.

The standards will lead to more expensive appliances but say consumers will save money in the long run on their energy bills.  The standards also provide a opportunity to save consumers money.  The new efficiency standards will save wealthy consumers money in the long run, because they can afford to pay the higher costs for new household appliances.  Lower-income consumers will have a tough time paying for the more expensive appliances, and are likely to keep using older ones.

While many of the efficiency rules target household appliances, others focus on business appliances, such as commercial ice-makers, commercial refrigerators and walk-in coolers and freezers.  The Air Conditioning, Heating and Refrigeration Institute is challenging the later two rules in federal court.

The push for tougher efficiency standards was initially ushered in with the 2009 stimulus bill, which included $16.8 billion for the Energy Department to promote efficiency.  (The Hill, 8/29/2014)

Tuesday, August 26, 2014

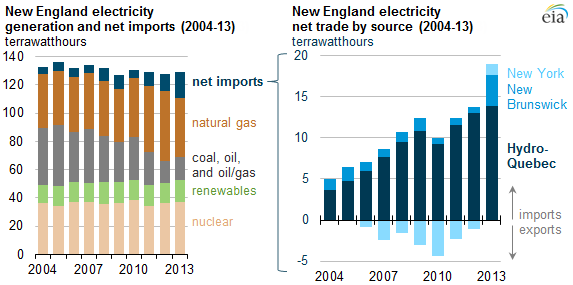
New England Relies on Natural Gas & Hydro from Canada


graph of New England electricity generation and net imports and New England electricity net trade by source, as explained in the article text
Source: U.S. Energy Information Administration, from ISO New England


Electric operators in New England have been both generating more electricity from natural gas and importing more hydroelectric generation from Quebec over the past decade. These two sources of electricity are displacing the use of coal and oil as generation fuels in New England.
 
Recent and planned closures of large power plants may cause the independent system operator for New England (ISO-NE) to continue to rely on an increasing amount of hydropower from Quebec. The 745-megawatt (MW) coal- and oil-fueled Salem Harbor Power Station ceased operation on June 1. Pending shutdowns include the 605-MW Vermont Yankee nuclear facility, expected to be shut down at the end of 2014, and the 1,520-MW Brayton Point coal- and natural gas/oil-fired power plant, expected to be shut down in 2017. To make up for the loss of these generators, northeastern utilities and Hydro-Quebec have proposed constructing several transmission lines, including the 1,200-MW Northern Pass, to increase transmission of electricity from Canada. Hydro-Quebec has more than 36,000 MW of installed hydroelectric capacity and has been exporting electricity to New England and New York since the 1980s.

New England states have several reasons to further limit their use of electricity generated from fossil fuels. Constraints on some of the pipelines delivering natural gas into New England have contributed to higher natural gas prices and made electricity relatively more expensive. Also, all New England states have renewable portfolio standards (or in Vermont, a nonbinding goal) requiring that a certain percentage of their electricity comes from renewable sources. Goals and qualifying renewable sources differ by state. For instance, Rhode Island's goal is 16% renewable electricity by 2020 and New Hampshire's is 24.8% by 2025; both states have limits on the size of hydroelectric facilities whose generation qualifies.

Several New England states also have energy efficiency resource standards or goals, which act like renewable portfolio standards, but are for implementing energy efficiency. Energy efficiency is among the reasons for relatively little change in total system demand over the past decade in New England, despite 3% growth in total population from 2004 to 2012.

Finally, New England states are part of the Regional Greenhouse Gas Initiative (RGGI), a market-based regulatory program that places a cap on carbon dioxide emissions from the power sector. The cap is reduced over time, encouraging states to generate more of their electricity using low- or zero-carbon sources. (DOE-EIA)

NRC Approves Nuclear Waste Confidence Rule(s)

The U.S. Nuclear Regulatory Commission (NRC) met today in an Affirmation Session and voted to approve a Nuclear Waste Confidence Rule that allows nuclear companies to continue to store nuclear waste on site until a national repository can be contructed.  NRC also lifted the moratorium on licensing nuclear power plants.

Affirmation Session

a. Final Rule :Continued Storage Spent Nuclear Fuel (RIN 3150-AJ20) 

The Commission approved a final rule and its associated generic environmental impact statement (GEIS) amending 10 CFR Part 51 to revise the generic determination on the environmental impacts of continued storage of spent nuclear fuel beyond the licensed life for operation of a reactor, with the changes in attachment 5.

In implementing the published GEIS findings into site-specific environmental analyses, the staff should utilize approaches that are transparent to the public on how these impact ranges are considered for each specific site.

b. Direct Final Rule: SGI–Modified Handing Categorization Materials Facilities (RIN 3150-AJ18)

The Commission approved a direct final rule and the companion proposed rule amending 10 CFR Parts 30, 37, 73, and 150 to remove the Safeguards Information – Modified Handling (SGIM) designation of the security-related information for large irradiators, manufacturers and distributors, and for transport of category 1 quantities of radioactive material, with the changes in attachments 1 and 2. Storage Spent Nuclear Fuel–Memo & Order Final Licensing Decisions & Pending Contentions

c. Continued Storage Spent Nuclear Fuel–Memo & Order Final Licensing Decisions & Pending Contentions

The Commission approved a Memorandum and Order lifting the suspension on final licensing decisions that the Commission imposed in CLI-12-16 as of the effective date of the Continued Storage Rule, and providing direction with respect to “continued storage” contentions that are currently held in abeyance in twenty-one adjudications before the Commission and the Atomic Safety and Licensing Boards. (Subsequently, on August 26, 2014, the Secretary signed the Memorandum and Order.)

d. Direct Final Rule: Adding Shine Medical Technologies, Inc.'s Accelerator-Driven Subcritical Operating Assembly to the Definition of Utilization Facility

The Commission approved a direct final rule and companion proposed rule amending 10 CFR Part 50.2 to add SHINE Medical Technologies, Inc.’s (SHINE) proposed accelerator-driven subcritical operating assemblies to the definition of a “utilization facility,” subject to the changes in attachments 3 and 4. This rule will allow the U.S. Nuclear Regulatory Commission (NRC) staff to conduct an efficient and effective licensing review of the SHINE construction permit application and subsequent operating license application under 10 CFR Part 50, “Domestic Licensing of Production and Utilization Facilities.”  

Attachment 5 highlights:

As noted in the GEIS, the former “Findings” were outputs of previous Waste Confidence proceedings, which included an environmental assessment and finding of no significant impact. In contrast, the current GEIS provides a detailed analysis under NEPA and provides an analysis of specific impacts.’

...the Commission has concluded in this GEIS that deep geologic disposal remains technically feasible.

This analysis does not constitute an endorsement of an extended timeframe for onsite storage of spent fuel as the appropriate long-term solution for disposition of spent fuel and high-level waste.’

...does not imply that spent fuel cannot be stored safely. To the contrary, the analysis documented in the GEIS is predicated on the ability to store spent fuel safely over the short-term, long-term, and indefinite timeframes. (NRC)

---------------------------------------------------------------------------------------------------------

Days before the Affirmation Session, several environmental groups attempted to delay the meeting until after NRC Commissioner Willim (Bill) Magwood in a futile attempt to garner enough votes to defeat the approve of the rule.  Commissioner Magwood's last day at NRC is August 31, when he leaves to head the Nuclear Energy Agency.

The Center supported holding the meeting during its August 26 assigned time and supported approval of the Waste Confidence Rule.

Friday, August 22, 2014

NRC Should Vote On Nuclear Waste Conficence Rule on August 26

The Nuclear Regulatory Commission (NRC) should not postpone its August 26 vote on the proposed rule on long-term nuclear-waste storage and its plan to lift a hold on reactor licensing that the commission approved two years ago. 

Commissioner William Magwood should not be an issue regarding the timing of the vote.  He is an NRC commissioner in good standing and has served as an honorable public servant for many years.  We wish Mr. Magwood well as he leaves the NRC to become director of the non-government Nuclear Energy Agency (NEA) on Aug. 31.

Bill Magwood
Mr. Magwood in no way represents a conflict of interest because of his new position with NEA.  Mr. Magwood is still employed with the NRC and is perfectfly capable of performing his professional duties as a seasoned commissioner of the agency.  Mr. Magwood has participated in all of the proceedings and information related to the Waste Confidence rulemaking.  To postpone the vote until after he is gone from the agency will rob the public of his experience and background regarding these vitally important issues.

This is a very important vote and opponents should not assume which way Mr. Magwood is going to vote.  Nobody knows how Mr. Magwood will vote but his experience is very important regarding the issue of long-term storage and disposal of spent reactor fuel. (Wash Post, 8/21/2014)


Wednesday, August 20, 2014

Dominion Wildlife & Habitat Protection

Biodiversity & Habitat Protection


The protection of species and habitats on the lands, rights-of-way, and waterways around Dominion's facilities is an integral part of Dominion’s commitment to responsible environmental stewardship.
 

Some examples of their ecosystem conservation initiatives and partnerships include the following:

 
  • Cove Point Beach Restoration. In cooperation with various regulatory, environmental and community groups, Dominion helped rebuild a buffer zone separating the Chesapeake Bay and a freshwater marsh using native grasses and plants. (See related video).

  • The Center for Conservation Biology Partnership. With the bald eagle population in Virginia steadily growing, the competition for nesting sites and resources is also increasing. One such nesting site is located on a Dominion transmission structure in central Virginia. With Dominion’s assistance, the Center for Conservation Biology at the College of William and Mary is studying this nest using video recording equipment installed by Dominion employees. Monitoring of the nest will improve understanding of bald eagle behavior and population dynamics in Virginia.

  • Roanoke River Fish Restoration. Dominion is involved in a long term study of “diadromous” fish populations in the Roanoke River, North Carolina. Diadromous fish, such as American shad and striped bass, generally live in the ocean and return to freshwater rivers to spawn; or like American eels, they live in rivers and migrate to the ocean to spawn. As the owner of a hydroelectric dam on the Roanoke River, Dominion works with state and federal agencies to assess and implement programs designed to support these fish populations.
 

Show Content Avian and Wildlife Protection

Show Content Wildlife Preservation

Show Content Rare Plant Protection

Show Content Land Conservation

Show Content Partnerships


(Dominion)

Exelon - PEPCO Merger

Chicago-based Exelon has filed an application with the Maryland Public Service Commission for approval to acquire Pepco Holdings, the D.C.-based utility serving about 537,000 customers in Washington’s Maryland suburbs.  Pepco has more than 2 million customers in an arc stretching from Washington and its Maryland suburbs, east to the Delaware shore and north to New Jersey.

The all-cash deal, announced in April and valued at about $6.8 billion, will cement Exelon’s hold on the Mid-Atlantic power market by adding Atlantic City Electric, Delmarva Power and Pepco to the three utilities Exelon owns: BGE, ComEd and Peco.

 
The process, which follows similar filings in the District, New Jersey and Delaware, is expected to take between 12 and 15 months for approval in all jurisdictions.

To help smooth the approval process, Exelon has committed $50 million in charitable contributions over the next decade to communities served by Pepco.
Exelon also said it will provide $40 million for a “Customer Investment Fund,” which the Maryland PSC may use for customer benefits such as bill credits, low-income assistance and energy efficiency.

Exelon, which owns 23 nuclear power plants, is acquiring a gas and electric transmission company that is one-fifth its size. Pepco, having sold its power plants several years ago, buys its electricity from others.

The agreement comes three years after Exelon bought Baltimore-based Constellation Energy Group, parent of Baltimore Gas and Electric, for $7.9 billion in a deal that extended Exelon’s reach into 38 states and two Canadian provinces.  (Wash Post, 8/19/2014)

Friday, August 08, 2014

Mining Energy Production Large Part of State Economies

graph of mining as a share of the economy for select states and the United States, as explained in the article text

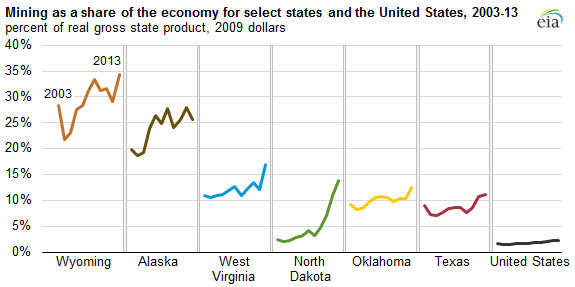
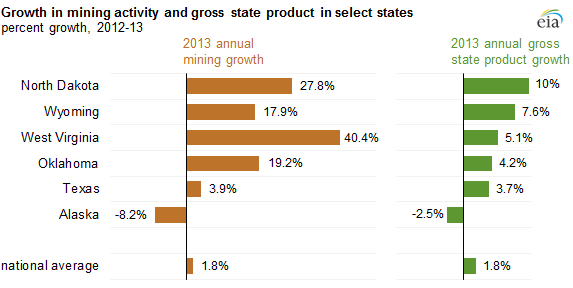
At the national level, establishments that extract crude oil and natural gas as well as naturally occurring mineral solids, such as coal and ores, collectively referred to as the mining sector in economic data, accounted for about 2% of the U.S. economy last year. In some states, though, the mining sector accounts for a much larger share of the economy. Of the six states where mining comprised more than 10% of the state's economy in 2013, mining growth resulted in five of those states having higher economic growth than the national average.
  • Wyoming. With crude oil and natural gas production from the Niobrara formation and coal mining from the Powder River Basin, Wyoming derives a larger share of its economic output from mining than any other state. In 2013, Wyoming's economic output from mining grew 18% between 2012 and 2013.
  • Alaska. Alaska has the second-largest share of its economy tied to mining activity. An 8% decrease in mining activity in 2013, reflecting a drop in oil production from the North Slope, contributed to the decline of Alaska's total GDP by 2.5% in 2013, the largest decline in the nation.
  • West Virginia. Most of West Virginia's mining activity is from coal mining, but natural gas production from the Marcellus shale in West Virginia has increased in recent years. The sector grew from 11% of total economic activity in 2003 to 17% in 2013.
  • North Dakota. In percentage terms, North Dakota has experienced more change in its economic makeup from mining activity than any other state, going from 2% of its economy in 2003 to 14% in 2013. North Dakota's crude oil production surpassed 1 million barrels per day in average monthly oil production earlier this year, because of production in the Bakken region. Associated effects from Bakken development, such as growth in construction, real estate rental and leasing, and accommodation and food services, also increased economic output. Growth in the mining sector has helped North Dakota achieve the lowest unemployment rate in the nation at 2.7% as of June.
  • Oklahoma. Oklahoma has significant oil and natural gas production, ranking fifth nationally in the volume of crude oil production and fourth in natural gas production. The state saw 19% growth in mining activity, up from its ten-year average of 7%. Oklahoma’s significant refining and transportation activity is not included in the mining sector data.
  • Texas. In absolute terms, mining activity in Texas in 2013 was more than seven times greater than the next largest state, Oklahoma. But compared to the states discussed above, Texas’s economy is much larger, so mining only accounts for about 11% of its economy. Much of the recent growth in mining has come from rapidly growing oil and gas production in the Eagle Ford formation and Permian Basin.
graph of growth in mining activity and gross state product in select states, as explained in the article text

Saturday, August 02, 2014

Enhanced Oil Recovery Using Carbon Dioxide

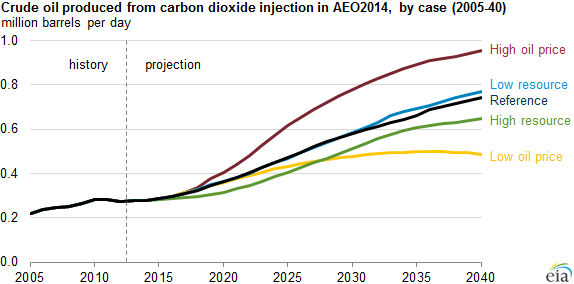
In the 2014 Annual Energy Outlook (AEO2014), EIA projects that the price of oil will largely determine whether to use carbon dioxide (CO2) enhanced oil recovery (EOR) technologies to extract additional crude oil from existing producing fields. The injection of CO2 gas into oil reservoirs at high pressure forces the CO2 to mix with oil. This reduces the oil's viscosity and causes the oil to increase in volume (swell). The result is an increase in the total cumulative volume of oil produced and in the percentage of oil-in-place that is recovered. The decision by a producer whether or not to employ this technique depends on a number of factors, including the geophysical properties of the reservoir, the oil within that reservoir, the cost of applying CO2 EOR, and the revenue received from additional production.


graph of crude oil produced from carbon dioxide injection in AEO2014, as explained in the article text
Source: U.S. Energy Information Administration, Annual Energy Outlook 2014


The injection of miscible (capable of being mixed) CO2 into old oil fields to recover more of the oil-in-place is an expensive undertaking. The cost of the CO2 itself can add $20 to $30 per barrel of oil produced. In addition, the producer must pay for surface facilities to separate the CO2 from the production stream and compress it back into the oil reservoir. The producer also incurs a financial cost for the time delay associated with repressurizing old reservoirs. Oil prices thus play an important role in determining whether the additional production resulting from applying CO2 EOR to old fields is sufficient to make this process commercially and economically feasible. (DOE-EIA)
Friday, August 01, 2014

Average Electricity Price At All-Time High

According to the Bureau of Labor Statistics, for the first time ever, the average price for a kilowatthour (KWH) of electricity in the United States hit a record 14.3 cents in June 2014.

Average Price for a KWH of Electricity

Typically, the cost of electricity peaks in summer, declines in fall, and hits its lowest point of the year during winter.

Electricity Price Index 1913-2013

According to the Energy Information Administration--overall electricity production with a total of 1,329,042 million KWH.

According to the Census Bureau, however, the resident population of the United States increased from 300,888,674 in April 2007 to 317,787,997 in April 2014. So, per capita electricity production in the first four months of 2014 (0.004182 million KWH per person) was less than the per capita electricity production in the first four months of 2007 (0.004316 million KWH per person).

Electricity Production Per Capita


Coal is the top fuel source of electricity production. Such production dropped by 15% from 2007 until today (644,052 million KWH to 548,297 million KWH. That is a drop of 95,755 million KWH)

Electricity production from nuclear power declined from 260,838 million KWH in January-April 2007 to 254,485 in January-April 2014.

Electricity production from conventional hydroelectric power declined from 92,873 million KWH to 88,364.

Production from petroleum declined from 24,974 million KWH to 14,931.

The largest increase in electricity production came from natural gas—which climbed from generating 234,331 million KWH in the first four months of 2007 to generating 318,958 million KWH in the first four months of 2014.  (CNS News, 7/29/2014)

Thursday, July 31, 2014

Dr. Yujie Dong Visits United States

Dr. Yujie Dong and his wife Amy Liu visited Washington, DC from July 26-31. This video shows them visiting sites around Washington, DC. on Wednesday, July 30, 2014.


Dr. Yujie Dong is the Director of the High Temperature Reactor Design Division, Institute of Nuclear and New Energy Technology (INET) at Tsinghua University, Beijing, China. Dr. Dong is leading the development team for the Pebble Bed Modular Reactor (PBMR). His team has built a functioning PBMR research reactor about 40 miles Northwest of Beijing near the Great Wall. The team is currently in the process of constructing a commercial PBMR near Weifang, China.

Previous Visit in 2007

Tuesday, July 29, 2014

Apple's Solar Powered Cloud


Data centers require huge loads of electricity to maintain climatic conditions and run the servers carrying out billions of electronic transactions every day. With Apple’s solar farm, customers could now be confident that downloading an app or video-chatting a friend would not increase carbon pollution.

The 55,000 solar panels tracking the course of the sun from a 400,000 square meter field across the road from Apple’s data center in Maiden, North Carolina were not in the picture seven years ago when Duke Energy and local government officials sought to entice Apple to open up a data center in North Carolina.  (Grist, 7/28/2014)

Saturday, July 26, 2014

Champlain Hudson Power Express Environmental Impact Statement

Champlain Hudson Power Express Transmission Line EIS

The United States Department of Energy (DOE) is preparing an environmental impact statement (EIS) to evaluate potential environmental impacts associated with the proposed Champlain Hudson Power Express (CHPE) transmission line between the U.S. and Canada.  DOE has a web site that is designed to provide up-to-date EIS-related information to the public and other interested parties.


 DOE has determined an EIS to be the proper National Environmental Policy Act of 1969 (NEPA) compliance document. The EIS will only address potential impacts in the United States; NEPA does not require an analysis of environmental impacts that occur within Canada. The EIS, however, will evaluate all relevant environmental impacts within the U.S. related to or caused by project-related activities in Canada. (DOE)

Friday, July 25, 2014

U.S. Dept of Transportation Proposes New Oil Tank Car Rules

The U.S. Department of Transportation (DOT) is proposing to phase out thousands of railroad tank cars that carry crude oil within two years once it adopts proposed rules to upgrade safety for trains carrying flammable liquids.  Tens of thousands of these older tank cars, known as DOT-111s, will have to be replaced or retrofitted under the proposed rules.

The proposals come after a string of explosive derailments involving trains filled with oil from the Bakken Shale and will change how flammable liquids are transported in North America.  The rapidly growing amount of crude oil moving on the nation's railroads has sparked protest and concerns by local fire chiefs, who worry they aren't prepared for a catastrophic crash.  Railroads, oil companies and railcar owners have been expecting new U.S. regulations meant to improve the safety of oil shipments in the wake of several fiery train accidents. A year ago, a train full of oil from North Dakota exploded in a rural Quebec town, killing 47 people.  The federal government has also reported that crude oil from North Dakota's Bakken Shale is volatile and contains large levels of combustible gases.


Crude-carrying tank cars would need to upgraded by 2017. The proposed regulations would also give the ethanol industry until 2018 to improve or replace tank cars that carry that fuel. The deadline for cars used to transport other flammable liquids that typically pose less of a hazard than oil or ethanol would extend to 2020.
 
Other new requirements proposed include a 40-mile-per-hour speed limit until sturdier tank cars can be built or existing railcars can be strengthened, as well as other rules that cover tank-car design, routing, brakes and testing of hazardous liquids.

The proposed rules must be posted for 60 days to give the public, rail industry and other parties a chance to comment. The final rule is expected to become effective early next year. The rules also call for the rail industry to design routes based on safety and security factors.


The proposed requirements would apply to any train with 20 or more tank cars of oil, ethanol or a comparable fuel to be categorized as a "high-hazard flammable train" and subject to the new rules. It has become common for dedicated oil trains consisting of 100 or more railcars filled with crude to operate as a pipeline on wheels.

DOT will ask for comment from industry and emergency-response officials on railcar design. The rules lay out several options, including improved brakes and thicker, 9/16th-inch steel walls on tank cars. The new design would cover all cars built after October 2015. Existing cars would need to be retrofitted, retired or used to carry less flammable liquids.


There are about 80,000 DOT-111 railcars built before 2011 that transport oil, ethanol and other flammable liquids and another 23,000 built in recent years with more crash-resistant features, according to the Railway Supply Institute's latest estimate.

The proposed rules leave open whether the 40-mph limit for high-hazard trains would only apply in certain urban areas. Trains with upgraded tank cars would be allowed to travel at 50 mph. Some experts had advocated for limiting oil trains to speeds of 30 mph or lower, but rail executives warned such a move could snarl the entire country's freight system.  (WSJ, 7/23/2-014)

EDF and Google To Map Natural Gas Leaks

The Environmental Defense Fund and Google's Earth Outreach program are going to map natural gas leaks in Boston, Indianapolis and New York's State Island. The interactive maps are the first step of a pilot project to use Google's Street View cars to measure environmental indicators. EDF says it worked with utilities to validate the findings.

The American Gas Association (AGA) notes that only a small fraction of natural gas leaks come from local utility pipelines.  AGA also notes that utilities have lowered emissions by 22% since 1990. AGA says that  in their attempt to raise the awareness of natural gas emissions, the EDF campaign understates that utilities are working with state and local policymakers to effectively reduce emissions by adopting innovative rate mechanisms to upgrade, replace and modernize natural gas distribution pipelines for safety and economic reasons.  (Frank Maisano)

Monday, June 30, 2014

Flaring Fracking Gas

Some oil companies are flaring gas and using diesel to fuel the pumps.

Excess natural gas is burned off at a Bakken Shale site.
Minneapolis Star Tribune/Zuma

Thousands of wells in the Bakken Shale area dot the landscape and are producing gas as a byproduct of hydraulic fracturing and horizontal drilling for oil.   Because North Dakota lacks adequate infrastructure, drillers are forced to burn off whatever they can't capture and ship to market. In April alone, such wells burned 10.3 billion cubic feet of natural gas, according to the state, valued at nearly $50 million.

North Dakota's regulations have struggled to keep pace with the drilling and flaring.  Burning off natural gas degrades air quality. And it is being reported that some producers aren't paying all the royalties and taxes owed on the gas that is flared. Energy companies lose out on gas revenue, too, but that is offset by what they generate from Bakken crude oil.

Stung by criticism that it has allowed oil producers to flare wells indefinitely, the North Dakota Industrial Commission on June 1 adopted rules requiring that gas-capture plans be submitted for companies to get a new drilling permits. The rules require producers to identify gas-processing plants and proposed connection points for gas lines but don't affect permits that already had been issued. The commission, which promotes as well as regulates the drilling industry, on Tuesday is expected to announce measures to limit flaring of existing wells. The federal government also is considering new limits on flaring.

In the past five years, North Dakota has climbed from the country's sixth-largest oil producer to the only state after Texas to produce more than a million barrels of oil a day. That has brought investment and job growth to a state economy once largely dependent on agriculture. While Texas captures all but 1% of the natural gas produced, North Dakota burns 30% of its output. Oil companies can ship crude, which fetches 20 times more than gas per barrel of oil equivalent, in tanker trucks to pipelines or rail terminals. Transporting natural gas requires a pipeline connection at the source, however, and North Dakota has far fewer of such pipes and less processing capacity than other oil-producing states.  (WSJ, 6/30/2014)

Monday, June 23, 2014

Supreme Court Puts Minor Limit on Obama EPA Global Warming Rule

The Supreme Court on today placed a limit on one part of the Obama administration's global warming proposals.  Though narrowing one Clean Air Act program (the "prevention of significant deterioration" permit program), the Court confirmed that the permit program does limit carbon emissions from the biggest polluters. The justices said that the Environmental Protection Agency lacks authority in some cases to force companies to evaluate ways to reduce carbon dioxide emissions. This rule applies when a company needs a permit to expand facilities or build new ones that would increase overall pollution.

The decision does not affect EPA proposals for first-time national standards for new and existing power plants. The most recent proposal aims at a 30 percent reduction in greenhouse gas emissions by 2030, but won’t take effect for at least another two years.
The outcome also preserves EPA’s authority over facilities that already emit pollutants that the agency regulates other than greenhouse gases.  Carbon dioxide is the chief gas linked to global warming.

The Clean Air Act's "prevention of significant deterioration" permit program requires that new and modified major stationary polluters such as power plants and factories use the best available technology to control their air pollution. Industry and its allies filed lawsuits seeking to exempt carbon pollution from this safeguard. While today's Supreme Court ruling does excuse some pollution sources from this requirement, the requirement will remain in effect for the worst carbon polluters, which account for roughly 83 percent of U.S. stationary source greenhouse gas emissions.

The U.S. Supreme Court upheld the Environmental Protection Agency’s (EPA) authority to limit carbon pollution.  Of crucial importance, the Court also left undisturbed other key Clean Air Act provisions authorizing EPA to issue "performance standards" limiting carbon pollution from sources such as power plants, refineries and cement kilns. Also preserved is the EPA's authority to set limits on carbon pollution from cars and trucks, including the limits EPA has already set in 2010 and subsequent years.

In 2007, the Supreme Court ruled that carbon dioxide and other greenhouse gases are pollutants under the Clean Air Act. The EPA officially determined in 2009 that carbon pollution endangers public health and welfare, contributing (among other impacts) to heat waves that worsen smog and sea-level rise that threatens coastal communities. In 2010, the EPA issued the first-ever federal carbon pollution standards for cars and trucks, and in 2012, a federal court of appeals upheld these standards against industry challenge.

The Supreme Court's action leaves in place key portions of the 2012 decision, as well as the following:
  • The EPA's 2009 finding that carbon pollution endangers public health and communities;
  • Emission standards the EPA issued in 2010 (and subsequent years) limiting carbon pollution from cars and trucks;
  • The EPA's authority under the Clean Air Act to adopt emission standards ("performance standards") for power plants and other stationary sources of carbon pollution; and
  • Key portions of the EPA's regulations (under the "prevention of significant deterioration" permit program) requiring major new and modified pollution sources such as power plants and factories to use the best available technology to limit carbon emissions.
History Of Supreme Court's Rulings Confirming EPA's Authority To Regulate Carbon Pollution

In a 2007 case about motor vehicle emissions, the Supreme Court ruled that carbon pollution and other greenhouse gases are air pollutants under the Clean Air Act, and that the EPA must limit carbon pollution if such pollution contributes to climate change. Massachusetts v. EPA, 549 U.S. 497 (2007).

In 2011, the Supreme Court confirmed EPA's authority under the Clean Air Act to issue "performance standards" limiting carbon pollution from stationary sources such as electric power plants. American Elec. Power Co. v. Connecticut, 131 S. Ct. 2527 (2011).

In the case decided today, the Supreme Court vindicated the EPA's endangerment finding and the agency's ground-breaking limits on carbon pollution from cars and trucks when the Court declined to take up challenges to those critically important actions. The Court also left undisturbed EPA's authority to set "performance standards" for power plants and other carbon emitters, and in addition confirmed that a separate Clean Air Act safeguard (the "prevention of significant deterioration" permit program) requires use of the best available technology to limit carbon pollution from the worst polluters. (EarthjusticeWash Post, AP, 6/23/2014)

Tuesday, June 17, 2014

Railroads Provide Majority of Coal To Utility Plants

graph of coal shipments to the electric power sector by transit mode and year, as explained in the article text
Source: U.S. Energy Information Administration, Form EIA-923, Power Plant Operations Report
Note: Sum of components may not equal 100% because of independent rounding. Other includes Pipeline, Other Waterway, Great Lakes Barge, Tidewater Pier, and Coastal Ports. Data for 2013 are preliminary.
Note: Intermodal transit uses multiple modes of delivery. Intermodal rail includes some movement over railways, while intermodal nonrail signifies multiple modes that do not include railway.


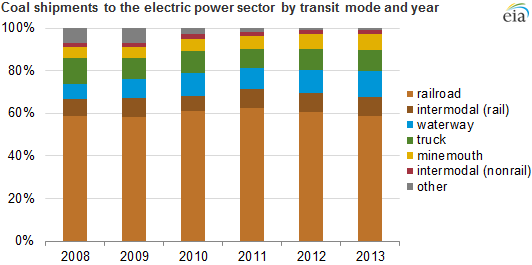
In 2013, electric power generators consumed 858 million tons of coal, accounting for 93% of all coal consumed in the United States and 39% of electric power generation.

Two-thirds of the coal (67%) was shipped either completely or in part by rail. The balance was moved by river barge (especially over the Mississippi and Ohio rivers and their tributaries), truck, and—for power plants located at the coal mine—by conveyor.
The coal transportation network is most densely concentrated in the eastern portion of the United States. This area contains many relatively small coal mines, most of the country's coal-fired power plants, and also rail infrastructure and suitable waterways. In the western United States, coal mines are often large, and a small number of routes handle large amounts of coal.

To better comprehend the amount of coal that a power plant consumes, consider that the largest coal-fired plants in the country receive 1 or 2 unit trains of coal each day. Each train has approximately 115 cars, and each car carries an average of 116 tons of coal. Some plants receive more than 26,000 tons of coal in a single day.

The primary mode by which a power plant receives its coal is largely determined by its location and access to the rail system. River barge is the most cost-effective method of transporting large quantities of coal over long distances, but the option is limited to plants located on a suitable river. Transporting coal by rail is more expensive, but two related facts result in its dominant market share of transportation: first, the United States is covered by an extensive railway network; and second, coal is produced in a relatively few parts of the country—predominantly in the Powder River Basin (Wyoming and Montana), the Illinois Basin, and Central and Northern Appalachia—while it is consumed by power plants in 46 of the 48 contiguous states.

After rail and river barge, the third most common method of receiving coal is by truck. This method, however, is typically employed only by plants that are located relatively close to a coal mine because of the higher cost on a per-ton-mile basis. Those plants that are located directly at or very near a mine can also have their coal delivered by conveyor, but, taken together, truck, barge, and conveyor movements make up less than 30% of the coal shipments in the country.
 
Although coal consumption in the electric power sector decreased by 18% from 2008 to 2013, and the number of coal-fired generators dropped from 1,445 to 1,285 units during that same period, the share of shipments made either exclusively by rail or with rail as the primary mode has remained effectively unchanged.

Between 2008 and 2013, the share of coal shipments made by river barge increased from 7% to 12%. In contrast, truck shipments fell from 12% to 10%, and shipments made by other modes (i.e., nonriver barge waterways, pipeline, tidewater piers, and coastal ports), fell from 7% to 1%. These changes occurred because many of the plants that received their coal by one of the other modes in 2008 either retired or shifted to another mode.  (DOE-EIA)
Thursday, June 05, 2014

Concentrating Solar Power

Solar  provided record-breaking growth and reached a total of more than 4,700 megawatts of new installed capacity in 2013 and 2014 will mark a major milestone for a different form of solar energy: concentrating solar power (CSP).

CSP technology uses mirrors to focus and concentrate sunlight onto a receiver from which a heat transfer fluid carries the thermal energy to a power block to generate electricity. The technology can generate energy even when the sun isn’t shining, helping to provide clean power at times of peak demand.

The Energy Department’s new report, 2014: The Year of Concentrating Solar Power,  focuses on five of the most innovative CSP plants in the world. All of these projects are expected to be switched on in the southwestern United States by the end of the year as a result of sustained, long-term investments by the Department and committed solar industry partners.

These five new utility-scale CSP plants will have the capacity to generate power for more than 350,000 average American homes.

Loan guarantees are an instrumental way the Energy Department helps technologies like CSP get the financing they historically have trouble accessing for their first few commercial projects. Through successful public-private partnerships, it is being proven that CSP is a commercially viable energy source in the U.S.

The five CSP plants:
  • Solana near Gila Bend, Arizona, was developed by Abengoa Solar, Inc., and opened in October 2013. The plant can dispatch energy to customers as needed during cloudy periods and after sunset. As the first power plant in the U.S. to use molten salt thermal energy storage, Solana generates electricity well into the evening to help meet the summer peak demand for air conditioning.
  • Genesis in Blythe, California, was developed by NextEra Energy Sources, LLC, and opened in April. Genesis expects to produce renewable electricity annually from more than 500,000 parabolic mirrors to power 60,000 average American homes.
  • Ivanpah Solar Electric Generating System in Ivanpah Dry Lake, California, was developed by BrightSource Energy and opened in February. The system uses over 300,000 software-controlled mirrors to track the sun across the sky and reflect the sunlight onto three towers. Ivanpah has the capacity to produce 392 megawatts of power and is expected to serve nearly 100,000 average American homes.
  • Crescent Dunes in Tonopah, Nevada, is being developed by SolarReserve and is expected to open by the end of the year. When completed, approximately 10,000 heliostats will be installed, and Crescent Dunes will be the nation’s first commercial-scale solar power tower facility with energy storage.
  • Mojave Solar One near Barstow, California, is being developed by Abengoa Solar and is expected to open later this year. The plant is expected to produce 250 megawatts of power and is one of the largest projects of its kind in the world.
Read the 2014: The Year of Concentrating Solar Power report to learn more about each of these plants and find out how the SunShot Initiative is advancing CSP technologies through six new energy storage projects. (DOE)

Monday, June 02, 2014

EPA Proposes CO2 Regulations For Existing Power Plants

Proposed Rule


Today the U.S. Environmental Protection Agency released the Clean Power Plan proposal, which for the first time cuts carbon pollution from existing power plants, the single largest source of carbon pollution in the United States. Today’s proposal will protect public health, move the United States toward a cleaner environment and fight climate change while supplying Americans with reliable and affordable power.

Power plants account for roughly one-third of all domestic greenhouse gas emissions in the United States. While there are limits in place for the level of arsenic, mercury, sulfur dioxide, nitrogen oxides, and particle pollution that power plants can emit, there are currently no national limits on carbon pollution levels.
 
With the Clean Power Plan, EPA is proposing guidelines that build on trends already underway in states and the power sector to cut carbon pollution from existing power plants, making them more efficient and less polluting. This proposal follows through on the common-sense steps laid out in President Obama’s Climate Action Plan and the June 2013 Presidential Memorandum.
 
By 2030, the steady and responsible steps EPA is taking will:
 
  • Cut carbon emission from the power sector by 30 percent nationwide below 2005 levels, which is equal to the emissions from powering more than half the homes in the United States for one year;
  • Cut particle pollution, nitrogen oxides, and sulfur dioxide by more than 25 percent as a co-benefit;
  • Avoid up to 6,600 premature deaths, up to 150,000 asthma attacks in children, and up to 490,000 missed work or school days—providing up to $93 billion in climate and public health benefits; and
  • Shrink electricity bills roughly 8 percent by increasing energy efficiency and reducing demand in the electricity system.

The Clean Power Plan will be implemented through a state-federal partnership under which states identify a path forward using either current or new electricity production and pollution control policies to meet the goals of the proposed program. The proposal provides guidelines for states to develop plans to meet state-specific goals to reduce carbon pollution and gives them the flexibility to design a program that makes the most sense for their unique situation. States can choose the right mix of generation using diverse fuels, energy efficiency and demand-side management to meet the goals and their own needs. It allows them to work alone to develop individual plans or to work together with other states to develop multi-state plans.

Also included in today’s proposal is a flexible timeline for states to follow for submitting plans to the agency—with plans due in June 2016, with the option to use a two-step process for submitting final plans if more time is needed. States that have already invested in energy efficiency programs will be able to build on these programs during the compliance period to help make progress toward meeting their goal.

Since last summer, EPA has directly engaged with state, tribal, and local governments, industry and labor leaders, non-profits, and others. The data, information and feedback provided during this effort helped guide the development of the proposal and further confirmed that states have been leading the way for years in saving families and businesses money through improving efficiency, while cleaning up pollution from power plants. To date, 47 states have utilities that run demand-side energy efficiency programs, 38 have renewable portfolio standards or goals, and 10 have market-based greenhouse gas emissions programs. Together, the agency believes that these programs represent a proven, common-sense approach to cutting carbon pollution—one in which electricity is generated and used as efficiently as possible and which promotes a greater reliance on lower-carbon power sources.

Today’s announcement marks the beginning of the second phase of the agency’s outreach efforts. EPA will accept comment on the proposal for 120 days after publication in the Federal Register and will hold four public hearings on the proposed Clean Power Plan during the week of July 28 in the following cities: Denver, Atlanta, Washington, DC and Pittsburgh. Based on this input, EPA will finalize standards next June following the schedule laid out in the June 2013 Presidential Memorandum.

In 2009, EPA determined that greenhouse gas pollution threatens Americans' health and welfare by leading to long lasting changes in our climate that can have a range of negative effects on human health and the environment. Taking steady, responsible steps to cut carbon pollution from existing power plants will protect children’s health and will move our nation toward a cleaner, more stable environment for future generations, while supplying the reliable, affordable power needed for economic growth.  (EPA)
 
Fact sheets and details about the proposed rule   

More information on President Obama’s Climate Action Plan

Thursday, May 29, 2014

President Obama West Point Speech Includes Global Warming

President Obama at West Point May 28


The Center has been encouraging the Obama administration to utilize the Defense Department (DoD) to assist in mitigating global warming.  Such DoD participation would be part of a public/private partnership to utilize wind, solar and nuclear power to provide emission free electricity and convert carbon dioxide into a transportation fuel.

You can click on the links to get more infomation about our Energy Defense Reservation Program and Defense Energy Reservation Program.

He is the excerpt that includes President Obama's comment about global warming being a national security crisis:
Keep in mind, not all international norms relate directly to armed conflict. We have a serious problem with cyber-attacks, which is why we’re working to shape and enforce rules of the road to secure our networks and our citizens. In the Asia Pacific, we’re supporting Southeast Asian nations as they negotiate a code of conduct with China on maritime disputes in the South China Sea. And we’re working to resolve these disputes through international law. That spirit of cooperation needs to energize the global effort to combat climate change -- a creeping national security crisis that will help shape your time in uniform, as we are called on to respond to refugee flows and natural disasters and conflicts over water and food, which is why next year I intend to make sure America is out front in putting together a global framework to preserve our planet.


(The White House)

Friday, May 23, 2014

U.S. Wood Pellet Exports Double in 2013 in Response to Growing European Demand

graph of U.S. wood pellet exports by destination, as explained in the article text
Source: U.S. Energy Information Administration, based on U.S. International Trade Commission data


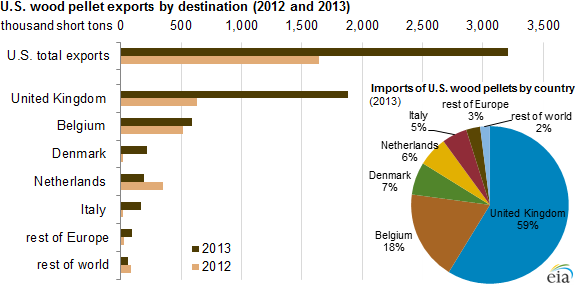
Wood pellet exports from the United States nearly doubled last year, from 1.6 million short tons (approximately 22 trillion Btu) in 2012 to 3.2 million short tons in 2013. More than 98% of these exports were delivered to Europe, and 99% originated from ports in the southeastern and lower Mid-Atlantic regions of the country.

Wood pellets are traditionally manufactured from wood waste (including sawdust, shavings, and wood chips) that results from wood processing activities, but they can also be produced from unprocessed harvested wood (generally at a higher cost). Wood pellets are primarily used as a residential heating fuel in the United States, but wood pellets can also be used for commercial heating and power generation applications. As recently as 2008, the U.S. Forest Service estimated that approximately 80% of U.S. wood pellet production was consumed domestically. However, because of strong demand growth in Europe, wood pellet exports have been the driving factor in the growth of domestic wood pellet production in recent years.

Growth of U.S. wood pellet exports has been concentrated in southeastern states, which have advantages in terms of abundant material supply and relatively low shipping costs to Europe. Transportation cost is a large part of the total cost of wood pellets; for example, according to Bloomberg New Energy Finance, transportation accounted for a quarter of the delivered price of wood pellets from the Southeast to the Netherlands in mid-2013. Shipping costs generally increase with distance, so the proximity of the United States to Europe compared to wood pellet manufacturers in Brazil and western Canada provides a pricing advantage for U.S. wood pellet exporters.

European countries, particularly the United Kingdom, are using wood pellets to replace coal for electricity generation and space heating. A principal driver in market activity is the European Commission's 2020 climate and energy package, binding legislation enacted in 2009 that implements the European Union's 20-20-20 targets. The 20-20-20 targets have three individual goals for 2020: to reduce EU greenhouse gas emissions by 20% from 1990 levels, to increase the renewable portion of EU energy consumption by 20%, and to improve EU energy efficiency by 20%.

In 2013, the top five importing countries of U.S. wood pellets exports were all European: the United Kingdom, Belgium, Denmark, the Netherlands, and Italy. The United Kingdom accounted for the majority (59%) of U.S. wood pellet exports, and more than tripled its imports from the United States between 2012 and 2013.

graph of United Kingdom wood pellet imports by source, as explained in the article text
Source: U.S. Energy Information Administration, based on Eurostat data


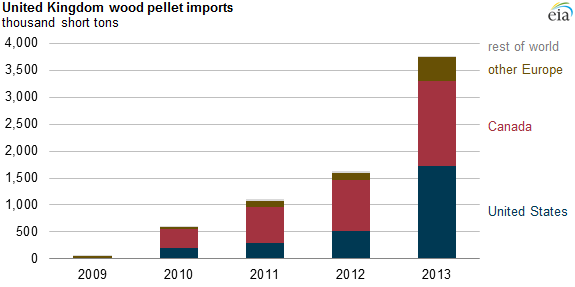
The United Kingdom's wood pellet imports from all sources have grown from near zero in 2009 to more than 3.5 million short tons in 2013. Because of the United Kingdom's Renewables Obligation program, the operators of several large coal-fired power plants have either retrofitted existing units to cofire biomass wood pellets with coal or have converted to 100% biomass. The Drax power plant—rated at nearly 4,000 megawatts and the largest coal-fired power plant in the United Kingdom—is in the process of implementing plans to convert half of its six generating units to run solely on wood pellets. The first of these three units entered service in 2013, while the remaining two conversions are planned for completion in 2015. According to Eurostat, the United Kingdom is also a major importer of wood pellets from Canada and, to a lesser extent, from other European sources. Until 2013, Canada was the primary source of the United Kingdom's import supply.  (DOE-EIA)

Nuclear Power Reactor Decommissioning & Spent Fuel Storage Status

Vermont Yankee
In the last year, the owners of five nuclear power reactors have confirmed their early closure. Kewaunee, Crystal River 3, San Onofre (SONGS) 2 & 3 and Vermont Yankee will join the list of nine nuclear power plants already holding either a DECON or SAFSTOR license in the USA. With Kewaunee and Vermont Yankee shutting down prematurely due to an unfavourable economic climate based on low gas prices, it’s widely believed that further plant closures may follow. Despite ten nuclear power plants having already been decommissioned in the USA, much of the original knowledge has been lost through retirements, plus external events such as Fukushima and 9/11 have had a huge impact on security and emergency planning that NPP plant closures in the 90s and before didn’t have to deal with.

Couple this unprecedented level of attention towards nuclear decommissioning with the multitude of questions surrounding what will happen to spent fuel once a nuclear power plant has completely shut down, and it’s clear that the backend of the nuclear life cycle is here to stay. As a result, Nuclear Energy Insider has put together an exclusive decommissioning and spent fuel storage map to help you mark out where and when major decommissioning, demolition and Independent spent fuel storage installation (ISFSI) construction will be taking place.  (Nuclear Energy Insider)

Wednesday, May 21, 2014

Industrial Onsite Electricity Concentrated in Chemicals, Oil, and Paper Manufacturing

graph of annual U.S. industrial nameplate capacity and generation, as explained in the article text

Source: U.S. Energy Information Administration, Power Plant Operations Report and Electric Power Annual


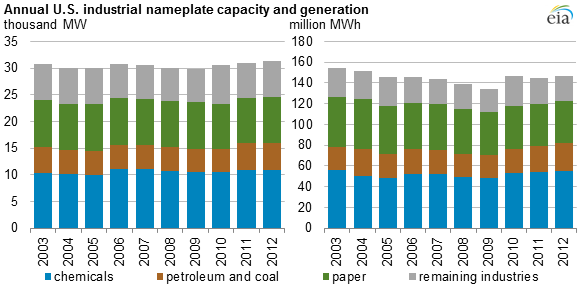
Onsite industrial generation represents approximately 3% of current U.S. generating capacity and approximately 4% of total megawatthours (MWh) of electricity generated in 2012, the latest year for which final data are available. More than 90% of the industrial generation capacity is concentrated in five industries. Of these industries, the chemicals, paper, and petroleum and coal industries account for more than 80% of onsite industrial generation, with the primary metals and food industries representing the remaining 20%.

Combined heat and power (CHP) facilities tend to be built in conjunction with certain industries that have heat or steam demands that directly affect their economic potential and profitability. Continuous operations with fairly constant heat or steam demands, coupled with meeting partial electricity demands, bolster the technical potential and likelihood of adoption of an industrial CHP, or cogeneration, facility and also may result in greater use of these facilities.

Power plants configured to produce both electricity and steam for other uses have a long history in the industrial sector. In the early 1900s, onsite generation was commonplace and also accounted for the majority of U.S. units because of the need for industrial heat, combined with the poor reliability and high cost of contemporary network-delivered electrical service. Subsequent improvements in electric grids throughout the nation led to a substantial decline in industrial cogeneration, with most electricity used at industrial facilities now coming from the grid rather than from onsite sources.

While the technical potential of CHP—the amount of industrial CHP possible to meet both heat and partial electric demands without taking into account measures of its cost-effectiveness—spans the entire industrial sector, the economic potential—the amount of industrial CHP that could be adopted because of its economic feasibility—helps to concentrate such potential in a few industries.

There is significant technical potential for more industrial cogeneration, which offers the potential for energy savings and cost reductions compared to the separate production of electricity and heat. Multiple policies at the federal, state, and local levels aim to promote CHP. However, even though expenditures for purchasing electricity are a significant cost for energy-intensive manufacturing facilities, the number of manufacturing facilities with and without active cogeneration suggest that CHP still faces significant challenges.

In addition to the direct sensitivities to the future cost of electricity and input fuels prices, there are other notable concerns particular to CHP investments identified by industry:
  • High or higher back-up changes or stand-by rates offered to industrial plants that want to pursue cogeneration while still maintaining a connection to the electric grid
  • Possible changes in CHP-related tax issues
  • State environmental policies
  • State siting and permitting requirements
  • Various federal standards
(DOE-EIA)